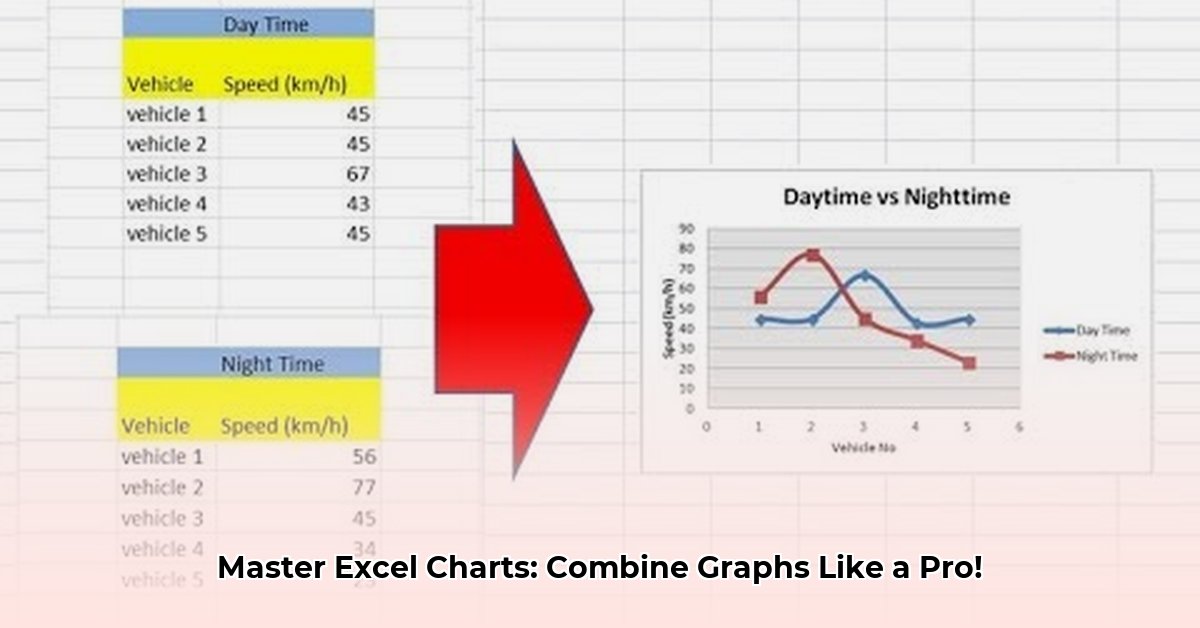
Combining two graphs in Excel can significantly enhance your data storytelling. This guide provides a step-by-step approach to merging charts, covering methods suitable for various skill levels and data complexities. Whether you're aiming for a quick visualization or a polished presentation, we'll equip you with the knowledge to choose the best approach.
The Speedy Copy-Paste Method: Quick and Easy
For a rapid, albeit less polished, solution, the copy-paste method offers immediate visual representation. This approach is best suited for informal analysis or when time is critical.
Steps:
- Select and Copy: Select the first chart and copy it using Ctrl+C (or Cmd+C on Mac).
- Paste: Navigate to the second chart and paste the copied chart using Ctrl+V (or Cmd+V).
- Adjust: Manually resize and reposition the pasted chart to fit alongside the original. Adjust colors and formatting for optimal visual appeal.
Advantages: Incredibly fast and easy to implement, requiring minimal Excel proficiency. Disadvantages: Can appear unprofessional if not carefully adjusted; lacks flexibility and precise control over chart elements. Suitable only for simple, non-critical visualizations. Does it offer the visual appeal you need for client presentations, or is it best for quick internal reviews?
Combo Charts: The Elegant Solution
Combo charts provide a more sophisticated and visually appealing way to combine multiple data sets within a single chart. This method allows for clearer comparisons and insights by displaying different data types (e.g., line and column charts) on shared axes.
Steps:
- Prepare your Data: Ensure your data is organized in adjacent columns, with each column representing a different data series. Clear data organization is key for successful chart creation.
- Insert Chart: Go to the "Insert" tab and select the "Combo" chart type.
- Choose Chart Type: Select the appropriate combo chart from the options provided (e.g., clustered column and line chart). Excel provides a visual preview to help you select the most appropriate option.
- Customize: Adjust chart elements like titles, labels, colors, and legends to ensure visual clarity and impact. Effective data visualization requires careful attention to detail.
Advantages: Visually appealing, versatile, and enables the combination of different chart types for insightful comparisons. Allows for significant customization options. Disadvantages: Requires a basic understanding of chart types and their suitability for different data. Not as quick as the copy-paste method.
VBA Macros: For Advanced Users
For those with programming expertise, VBA macros offer unmatched power and customization. This approach allows for automation and highly tailored chart creation, ideal for repetitive tasks or complex visualizations. However, this method requires a substantial learning curve.
Advantages: Highly customizable, automated chart generation for consistent results, suitable for complex scenarios. Disadvantages: Requires significant programming knowledge, significantly steeper learning curve compared to other methods. Requires a higher level of technical expertise than other methods.
Note: Detailed VBA code examples are beyond the scope of this introductory guide. Numerous online resources offer comprehensive tutorials on VBA chart manipulation.
Choosing the Right Method: A Comparative Overview
The optimal method for combining graphs depends on your specific needs and technical skills.
| Method | Speed | Visual Appeal | Customization | Skill Level Required |
|---|---|---|---|---|
| Copy & Paste | Very Fast | Low | Low | Beginner |
| Combo Charts | Moderate | High | High | Intermediate |
| VBA Macros | Slow | High | Extremely High | Advanced |
"Choosing the right method is key," says Dr. Anya Sharma, Data Visualization Expert at the University of California, Berkeley. "Consider your audience and the level of detail needed to communicate your insights effectively. A quick copy-paste might suffice for informal team discussions, while a finely-tuned combo chart is ideal for impacting presentations."
Beyond the Basics: Enhancing Your Charts
Remember, clear labeling and concise titles are critical for effective data communication. Consider adding data labels or trendlines to reinforce key findings and make your charts inherently more compelling. Don't be afraid to experiment with different chart styles and formatting to create truly compelling data visualizations. How can you further improve the visual clarity and impact of your newly combined graphs?
This comprehensive guide empowers you to confidently navigate the various methods for combining charts in Excel. By understanding the strengths and weaknesses of each approach, you can select the most effective technique to transform your data into engaging and informative visuals.